How to debug phantomjs tests in another browser
August 04, 2015
What can you do if your karma unit tests are failing or throwing an error?
Coding unit tests creates a similar set of problems as programming the code you wish to test.
- They can throw an error
- They can throw an exception
- Unexpectantly failing a test
- Just plain failing
Running karma with phantomjs
When running your javascript unit tests having them running as fast as possible is very desirable and phantomjs, the headless webkit browser, allows your tests to be run at speed with the output being returned to your console.
To use phantomjs as your testing browser in karma your need to install the node package karma-phantomjs-launcher and then reference it in your karma config.
    autoWatch: true,
    browsers:  ['PhantomJS'],
    plugins: [
      'karma-phantomjs-launcher',
      'karma-jasmine',
      'karma-webpack'
    ],
But if it is a headless browser running in a console how do debug it?
Phantomjs is a headless browser that runs in your console which, is great when your tests are all passing.
PhantomJS 1.9.8 (Mac OS X 0.0.0): Executed 18 of 18 SUCCESS (0.169 secs / 0.165 secs)But if your output looks like below then you probably wish you could open the testing browsers Developer Tools and debug the test manually.
PhantomJS 1.9.8 (Mac OS X 0.0.0): Executed 18 of 18 (1 FAILED) (0.163 secs / 0.161 secs)
PhantomJS 1.9.8 (Mac OS X 0.0.0) dropboxController should import the file, refresh and autosave the document FAILED
        Expected spy $emit to have been called with [ 'autosave' ] but it was never called.
        Expected spy $emit to have been called with [ 'document.refresh' ] but it was never called.
You can with karma
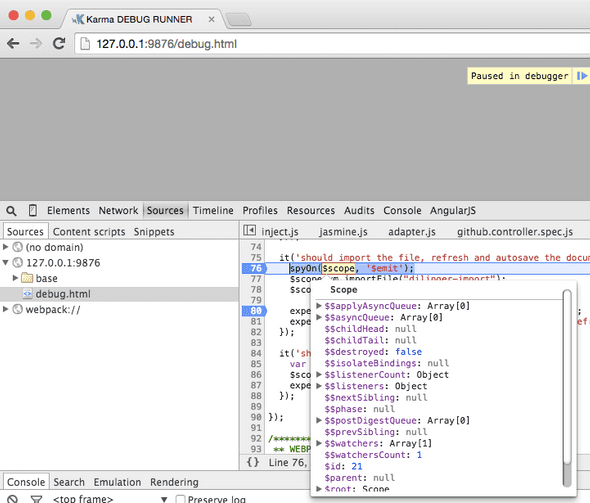
Even though, using karma as your test runner and phantomjs as the headless browser, you can still step through your code in another browsers Developer Tools.
In your karma config you specify the port that karma’s webserver will be listening on.
port: 9876,You can combine your local host address, the port number and the karma debug page in your browser of choice and then step through the code.
http://127.0.0.1:9876/debug.htmlIf you want to start debugging at a particular point you can add a debugger statement to your tests to break at that line.
debugger;
